

The Hidden Economics of iGaming: Who Really Makes the Most Money?
Everyone assumes operators are the ones getting rich. After all, they own the brand, they run the casino, they take the bets. The house always wins — so the house must be the winner, right?
Wrong.
The iGaming industry is a $120 billion ecosystem in 2026, and the money is distributed in ways that would surprise most people — including many people inside the industry. This article breaks open the value chain, names the real winners, puts real margins on the table, and explains why the most profitable entities in iGaming are often the ones you have never heard of.
The Scale of What We Are Talking About
Before we divide the pie, we need to understand how big the pie actually is.
The global online gambling market — encompassing sports betting, online casino, poker, and lottery — is currently valued at approximately $120 billion in gross gaming revenue (GGR) in 2026, growing from $78 billion just two years earlier in 2024. It is projected to hit $186 billion by 2029 at a compound annual growth rate of 12.3%.
Europe remains the largest online market, with €47.9 billion in online GGR in 2024 — 39% of the continent’s total gambling revenue. The US is growing fastest in dollar terms. Latin America and Africa are the frontier — chaotic, underregulated in parts, and exploding.
This is not a niche industry. This is one of the largest entertainment sectors on the planet. And the question of who captures what slice of it is not academic — it is the most important strategic question in the space.
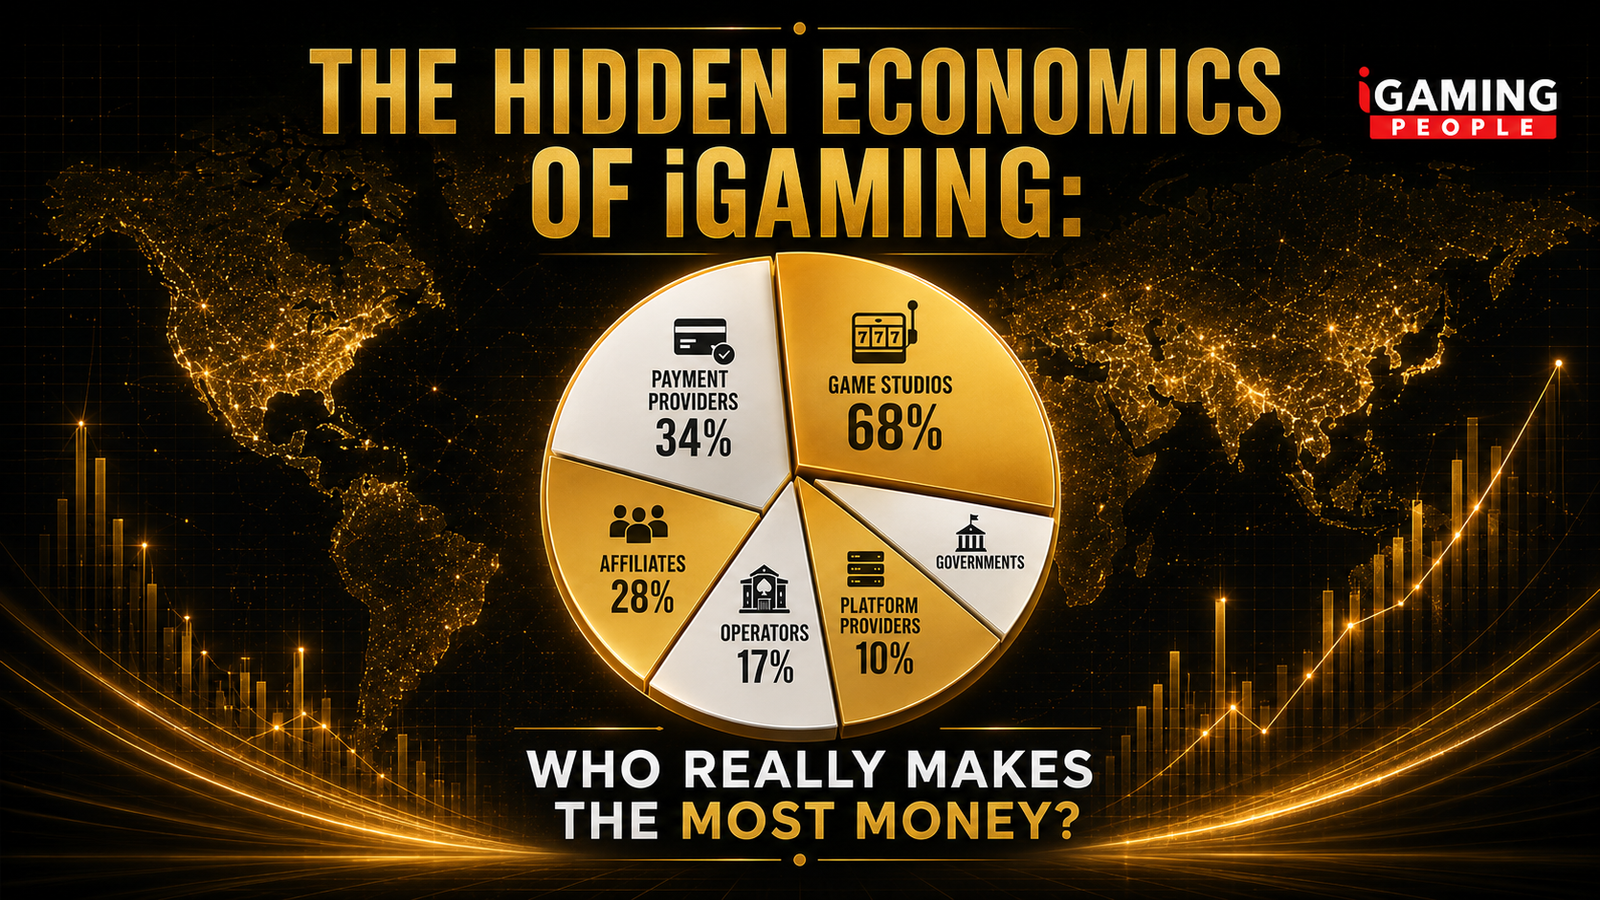
The iGaming Value Chain: Six Players, One Pie
Every euro a player loses on an online casino or sportsbook passes through six distinct hands before what remains is booked as profit. Understanding the order and the cut each hand takes is the key to understanding where the real money lives.

Here is the cast:
- Game Studios — the companies that build the actual games
- Platform/PAM Providers — the technology backbone operators run on
- Payment Providers — the pipes through which money flows
- Affiliates — the marketers who deliver the players
- Operators — the brands players know and interact with
- Regulators and Governments — the silent partners who take their cut first
Let us go through each one, with real numbers.
1. Game Studios — The Invisible Billionaires
EBITDA Margin: 65–70% | Profit Per €100 of GGR: €15–20 | Risk: Near Zero
If you want to find the most profitable company in iGaming — not by revenue, but by margin — you do not look at the operator. You look at the supplier. Specifically, you look at Evolution.
Evolution AB is a Swedish company that provides live casino games — Live Blackjack, Live Roulette, Live Baccarat, game shows like Crazy Time and Lightning Roulette — to essentially every significant online casino on the planet. In 2024, Evolution reported full-year net revenue of €2.06 billion and an adjusted EBITDA of €1.41 billion. That is an adjusted EBITDA margin of 68.4%.
To put that in context: for every €100 Evolution earns, €68 of it is profit before interest and taxes. The company operates with a margin that is genuinely extraordinary — comparable to the best software businesses in the world, sitting comfortably alongside names like Microsoft or Visa.
The margin is not an accident. It is structural. Evolution’s business model has three characteristics that make it almost uniquely profitable:
No player acquisition cost. Evolution never needs to acquire a single player. They build the product; the operators acquire the players. Evolution gets paid a revenue share — typically 4–17% of the GGR their games generate for each operator. A small operator pays towards the upper end. A global operator like Flutter or bet365 negotiates down to 4–8%. The weighted average across all 800+ operators is estimated at around 10–12% — without Evolution spending a single cent on bonuses, marketing, or conversion.
Recurring, scalable revenue. Every time a player sits at an Evolution table, the meter runs. The company operated over 1,700 live tables by end of 2024, running 24 hours a day, 365 days a year. The marginal cost of an additional player at an existing table is effectively zero.
No direct regulatory exposure. Evolution holds its own B2B licenses — but the compliance burden of player verification, responsible gaming, AML — that all falls on the operator. Evolution supplies the product; the operator carries the regulatory weight.
Across all operator sizes and game types, studios collectively extract an estimated 10–15% of total operator GGR through their revenue share agreements. On a global market of $120 billion, that represents a pool of $12–18 billion flowing to studios annually — with operating margins that dwarf every other player in the chain.
2. Platform and PAM Providers — The Infrastructure Tax
EBITDA Margin: 8–20% | Revenue Model: Rev Share + SaaS Fees | Risk: Medium
Every operator needs a backbone. The Player Account Management (PAM) system handles everything that keeps a gambling business running: player registration and KYC, wallet management, bonus engine, casino game aggregation, sports odds integration, reporting, compliance tools.
Kambi Group is the clearest publicly traded example of a sportsbook technology provider. In 2025, Kambi generated revenue of €162 million, with adjusted EBITA of €17.6 million — a margin of roughly 11%. That is a respectable but not extraordinary margin, and it tells an important story: platform providers carry real costs. Engineering teams, data centres, integrations, compliance tooling, customer service.
The platform tier’s revenue model is typically a percentage of operator GGR (often 3–6%) or a hybrid of rev share and fixed monthly SaaS fees. This means they earn more when operators earn more — and suffer when operators face regulatory headwinds. Kambi’s 2025 results explicitly cited “increased impact of gaming-related taxes” as a headwind — because when operators pay more to governments, there is less GGR to share.
3. Payment Providers — The Quiet Toll Road
EBITDA Margin: 25–40% | Revenue per Transaction: 1–3% | Risk: Regulatory
Every deposit a player makes and every withdrawal they receive runs through a payment processor. This is not glamorous — but it is consistently profitable, and the iGaming vertical is one of the most lucrative in the payments industry.
Nuvei, one of the most iGaming-focused payment processors in the world, reported an adjusted EBITDA margin of approximately 34% in its final period as a public company before going private. That figure reflects a business that combines payment processing with value-added services like fraud prevention, alternative payment method integration, and payouts management — all of which are uniquely complex and valuable in iGaming.
The iGaming payments premium exists for several reasons: transaction risk (chargebacks, fraud), payment method complexity (every market has different local methods), and withdrawal management (AML requirements for payout processing).
At even 1.5% average take on the payment flow, the global payment processing pool in iGaming exceeds $1.5–2 billion annually.
4. Affiliates — The High-Margin Middlemen (Having a Complicated Decade)
EBITDA Margin: 20–40% (peak); 15–30% (current) | Revenue Model: CPA + Rev Share | Risk: Very High
The affiliate business model, in its purest form, is one of the most elegant in iGaming. Build a website. Create content that ranks in Google. Drive players to operators. Get paid either a fixed fee per depositing player (CPA — typically €100–400 per player) or a lifetime revenue share (20–40% of the player’s net losses, forever).
At the peak, leading affiliates were generating EBITDA margins of 40–60%. The current reality is more complicated. Better Collective’s Q2 2025 revenue fell 18% year-on-year to €82 million. Catena Media saw revenue collapse from €76.7 million to €49.6 million — a 35% drop — as Google’s algorithm changes devastated SEO-heavy affiliate models.
Three forces converged simultaneously: Google’s algorithm penalising thin affiliate content, regulatory pressure on affiliate marketing models, and operator cost discipline compressing CPA rates.
Despite the squeeze, affiliates at the best-managed end remain genuinely attractive businesses. Gentoo Media maintained a 41% EBITDA margin in Q3 2025 by focusing on high-quality content and avoiding over-reliance on Google SEO — the kind of genuine industry journalism that AI cannot replicate.
5. Operators — The Most Visible, Often the Most Margined-Out
EBITDA Margin: 15–25% (large operators); 5–15% (mid-tier); negative (many new entrants) | Risk: Extreme
Here is the uncomfortable truth: most operators do not make extraordinary returns. The ones that do — Flutter, bet365 — do so through scale, operational excellence, and proprietary technology that reduces their dependency on the value chain participants above.
Flutter Entertainment generated $16.4 billion in revenue in 2025 — up 17% year-on-year — and $2.85 billion in adjusted EBITDA: a margin of 17.4%. After paying game studio rev share, platform costs, payment fees, affiliate commissions, bonuses, taxes, and compliance costs — what remains is the operator’s reward for building the brand, holding the license, and absorbing all regulatory risk.
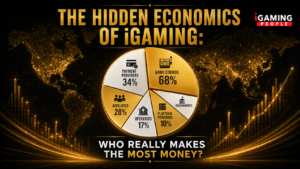
The €100 Player Loss — Where Does It Go?
Let us trace exactly what happens when a player deposits money and loses €100 on an online casino in a typical regulated European market.
| Cost Item | Amount | Who Gets It |
|---|---|---|
| Game studio rev share | €17.00 | Evolution, Pragmatic Play, etc. |
| Platform / PAM fee | €4.00 | Tech provider |
| Payment processing | €2.50 | Nuvei, Trustly, etc. |
| Affiliate commission | €15.00 | Affiliate (if player was referred) |
| Regulatory tax (21% UK / varies) | €21.00 | Government |
| Bonus cost (welcome / loyalty) | €8.00 | Player (re-distributed) |
| Marketing & other overhead | €12.00 | Operator absorbs |
| Operator EBITDA | €20.50 | Operator |
That €20.50 is the operator’s reward for everything. In high-tax markets, that number collapses further. The Netherlands moved to a 37.8% GGR tax in 2026. Austria charges 40%. France, if it legalises online casino, is proposing a rate of 55.6%. At those levels, the operator’s share drops below €10.
The bet365 Exception: Privately held, founded in a portacabin in Stoke-on-Trent in 2001, bet365’s 2024 accounts showed revenue of £4.3 billion and profit of approximately £1 billion — margins genuinely exceptional for an operator. The secret is proprietary technology, brand equity built over two decades, and operational efficiency that larger conglomerates cannot replicate. It is the exception, not the rule.
6. Regulators and Governments — The Biggest Silent Partner
“Margin”: 15–55% of GGR | Revenue: Tax Receipts | Risk: Zero
Nobody in the iGaming value chain earns risk-free. Except one party.
Governments set the rules, collect the taxes, and cash the cheques. In the UK, the gambling industry generates approximately £4.2 billion in tax revenues annually. Germany collected €2.49 billion in gambling taxes in 2024. Italy’s gambling tax revenues consistently top €10 billion when land-based is included.
The recent European tax escalation is the defining story of iGaming economics in 2025–26. A PwC study found that Western European markets that increased taxes saw average annual GGR growth of 6% between 2019 and 2024, compared to 17% in countries that maintained or reduced tax rates. Higher taxes grow the black market, reduce channelisation, and ultimately shrink the tax base governments were trying to grow.
The Frontier Difference: How Africa and Latin America Rewrite the Economics
The value chain above describes a mature, regulated European market. In Africa and Latin America — the two fastest-growing iGaming regions in the world — the economics look meaningfully different. And understanding those differences is increasingly critical for operators, suppliers, and investors.

Africa — Where Operators Earn More, But Carry More Risk
Africa’s total iGaming market reached an estimated $17.63 billion in 2025 — a number that still surprises most people in the industry. The continent’s largest operator by footprint, Super Group (parent of Betway), reported that Africa accounted for 44% of total revenue in Q1 2026 — generating $267 million in a single quarter, with adjusted EBITDA of $98 million. That is an EBITDA margin of approximately 37% on the Africa segment — nearly double Flutter’s global margin of 17.4%.
Why are African operator margins so much higher? Three structural reasons:
Lower regulatory tax burden. Most African markets charge GGR taxes in the 10–20% range — significantly below European levels. Nigeria charges approximately 15% of GGR. Kenya’s effective rate is comparable. Compared to the Netherlands at 37.8% or the UK at 21%, African operators retain a far larger share of every player loss.
Different game mix. As we covered in our deep dive on the 5/90 lottery market, Africa’s lottery sector runs on a fundamentally different economic model. National lottery operators — unlike online casino operators — do not pay game studio rev share on their core products, because they own the games. Ghana’s NLA, Nigeria’s Premier Lotto, and their counterparts across the continent keep a far larger share of every ticket sold. The $5.6 billion African lottery market flows through a simpler, more concentrated value chain than European casino.
Lower affiliate dependency. The affiliate model that takes 15–20% of European operator revenue barely exists in most African markets. Player acquisition happens through sports sponsorships, local agents, and mobile money integrations — channels that are cheaper and less extractive than the Western affiliate model. The savings flow directly to operator margin.
The risk side is real: regulatory instability (William Hill famously exited 13 African and Asian markets in 2025), currency volatility, mobile infrastructure constraints, and payment complexity. But for operators who navigate it well, Africa is the highest-margin large-scale iGaming market on the planet right now.
The payment layer in Africa is uniquely interesting. In Kenya, M-Pesa handles over 70% of lottery transactions. In Nigeria, local mobile money integrations dominate. The payment providers serving African iGaming are not the same companies serving Europe — the Nuveis and Trustlys of the world have limited penetration. Local payment aggregators and mobile money platforms capture the transaction fee layer, often at rates significantly below European payment processing costs. This means the payment toll road in Africa is cheaper — another advantage for operators willing to build the local integrations.
Latin America — The Margin Compression Frontier
Latin America tells a different story. As we analysed in our comprehensive guide to iGaming in Latin America, the region’s $6 billion market is in a phase of rapid regulatory maturation — which means the economics are converging toward the European model faster than most operators anticipated.
Brazil is the critical case study. Brazil’s CEB (Combined Exchange Betting) reached $2.95 billion in H1 2025 alone — enormous scale. But the regulatory framework that unlocked this growth simultaneously compressed margins. Brazil’s federal tax on GGR is 12% at the operator level — lower than Europe but rising. More significantly, Brazil’s SPA has banned credit cards and cryptocurrency for iGaming deposits, making PIX the dominant payment method with over 90% of deposit traffic. PIX charges near-zero transaction fees — which is excellent for operators’ payment cost structure, but creates a new challenge: with near-frictionless deposits and withdrawals, player retention and lifetime value become the primary competitive battleground.
The payment layer in Brazil therefore looks radically different from Europe. Where Nuvei and Trustly extract 1–3% on European iGaming transactions, PIX’s central bank infrastructure charges minimal fees. The savings do not flow to operators as margin — they flow to players as frictionless experience and to the competitive dynamics that demand investment in product, bonuses, and retention.
Colombia — the mature LATAM market — is converging toward European-style economics. A decade of regulated competition has compressed CPA rates, established affiliate culture, and created the kind of margin environment familiar to European operators. EBITDA margins for mid-market Colombian operators are now in the 10–15% range — significantly below the frontier economics of newer African markets.
The LATAM payment premium is real but regional. In markets outside Brazil, payment complexity is a genuine profit opportunity for specialist providers. Mexico’s OXXO cash voucher system, Argentina’s Mercado Pago integration requirements, Colombia’s PSE direct bank transfer — each creates a technical and commercial challenge that specialist payment providers solve and charge for. As we noted in our LATAM guide, operators who do not integrate the dominant local payment method in each market lose a significant percentage of potential deposits before the player ever sees the lobby.
The LATAM economics lesson is clear: get in early, before the market matures and margins compress. The operators and payment providers who entered Colombia in 2016 earned significantly better returns than those entering in 2026. The same dynamic is playing out in Brazil right now — the window for frontier margins is open, but it will not stay open long.
The Real Winner’s Table: Margin by Player
Here is the summary — laid out clearly, with real data from real public companies.
| Player | Representative Company | EBITDA Margin | Revenue Model | Risk Level |
|---|---|---|---|---|
| Game Studios | Evolution AB | 68% | % of Operator GGR | Low |
| Payment Providers | Nuvei (private since 2024) | ~34% | % of Transaction Value | Medium |
| African Operators | Super Group (Africa segment) | ~37% | GGR minus lower costs | High |
| Affiliates | Better Collective | 28–40% | CPA + Rev Share | High |
| Operators (large, global) | Flutter Entertainment | 17% | GGR minus all costs | Very High |
| Platform Providers | Kambi Group | 10% | % Rev Share + Fees | Medium |
| Operators (mid-tier, Europe) | Regional operators | 5–12% | GGR minus all costs | Extreme |
| Regulators | UK HMRC, GGL, etc. | N/A (risk-free take) | Tax on GGR | Zero |
Why Operators Are Still in This Business
Given the margin profile above, a legitimate question arises: why would anyone want to be an operator?
The answer is leverage and scale. An operator with 10 million active players and €2 billion in annual GGR is not generating 17% EBITDA on €100 player losses in the abstract — they are generating 17% of €2 billion. That is €340 million in EBITDA.
The other answer is optionality. Operators control the player relationship. Game studios need operators. Affiliates need operators. Payment providers need operators. The operator is the hub through which the entire value chain flows. The margin may be thinner, but the leverage is real.
The Structural Insight Nobody Tells You
The iGaming industry is structured like a tax-and-toll economy. Players lose money. The money flows upward through a cascade of claims — studios take their rev share, platforms take their fee, payment providers take their cut, affiliates take their commission, governments take their tax, and what remains is the operator’s margin.
The companies that thrive in this structure are not necessarily the ones with the most revenue. They are the ones with the highest leverage and the lowest risk. Evolution built the most profitable iGaming business in the world without ever acquiring a single player, managing a single license, or risking a single regulatory fine.
In Africa, the economics favour operators because the toll road is shorter and cheaper — lower taxes, weaker affiliates, simpler payment infrastructure. That window will not stay open forever. African regulators are watching European tax revenues with interest.
In Latin America, the toll road is being built in real time. Brazil’s PIX revolution is removing the payment toll while tightening regulation adds new compliance costs. The net effect is a market that is enormous, competitive, and converging rapidly toward European margin levels.
Understanding that flow — in London, in Lagos, in São Paulo — is not just academic.
The hidden economics of iGaming are not actually hidden. They are just rarely stated honestly.
The iGaming People covers the global gaming industry with a focus on insight, data, and the people behind the business. Follow us on LinkedIn and Twitter for daily iGaming news and analysis.
Related Reading:
- From Ghana to Nigeria: How a 60-Year-Old Number Game Became a $5.6 Billion Industry
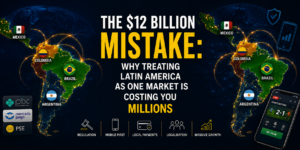
- The $12 Billion Mistake: Why Treating Latin America as One Market Is Costing Operators Millions
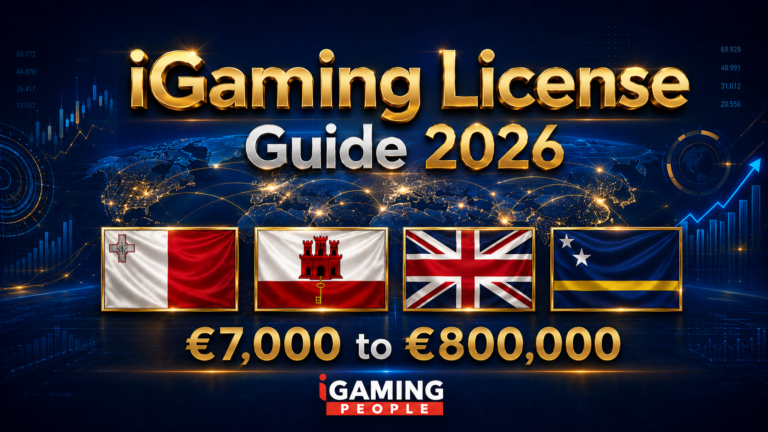
- iGaming License Guide 2026: From €7,000 to €800,000
Tags: iGaming Economics, iGaming Revenue, Game Studios, iGaming Operators, Payment Providers, Affiliates, Evolution Gaming, Flutter Entertainment, Africa iGaming, Latin America iGaming, iGaming Margins
Category: Industry Analysis | Market Intelligence | Economics
Slug: hidden-economics-igaming-who-makes-the-most-money
Focus Keyword: hidden economics iGaming
SEO Title: The Hidden Economics of iGaming — Who Really Makes the Most Money? | The iGaming People
Meta Description: Who really makes the most money in iGaming? Evolution earns 68% EBITDA. African operators earn 37%. Flutter earns 17%. The complete breakdown of the $120 billion iGaming value chain — with real margins, real companies, and real data.
Sources & References
[1] Evolution AB — Year-end Report 2024. Net revenue €2.06bn, adjusted EBITDA margin 68.4%, 1,700+ live tables. evolution.com/investors
[2] Evolution AB — Business Model. Revenue share range 4–17% sliding scale. evolution.com/investors/company-overview/business-model/
[3] Flutter Entertainment — Q4 and Full Year 2025 Financial Results. Revenue $16.4bn, adjusted EBITDA $2.85bn (17.4% margin). flutter.com
[4] Flutter Entertainment — FY2025 earnings. FanDuel US market share 41% sportsbook, 28% iGaming, ~70% US EBITDA.
[5] Kambi Group plc — Full Year 2025 Report. Revenue €162.0m, adjusted EBITA €17.6m (~10.9% margin). kambi.com
[6] Nuvei Corporation — SC 13E3/A filing, SEC 2024. Adjusted EBITDA margin ~34%. sec.gov
[7] Better Collective — Q2 2025 Quarterly Report. Revenue €82m (−18% YoY), EBITDA 28%. bettercollective.com/investors
[8] Catena Media — FY2024 Full Year Results. Revenue €49.6m (−35% from €76.7m). igamingfuture.com
[9] Gentoo Media — Q3 2025 Quarterly Results. EBITDA margin 41%. affpapa.com
[10] Global market sizing — DemandSage, Online Gambling Statistics 2026; H2 Gambling Capital projections. $120bn in 2026, $186bn projected 2029, CAGR 12.3%.
[11] European Gaming and Betting Association (EGBA) + H2 Gambling Capital — European Gambling Market 2025. Europe online GGR €47.9bn in 2024.
[12] UK Remote Gaming Duty (21% of GGR) — UK Parliament, Taxation of Gambling. Tax revenue £4.2bn. publications.parliament.uk
[13] Germany gambling tax receipts (€2.49bn, 2024) — H2 Gambling Capital, reported by esportsinsider.com, February 2025.
[14] Netherlands GGR tax 37.8% for 2026 — iGaming Expert, November 2025. igamingexpert.com
[15] PwC gambling tax study — Higher Gambling Taxes Linked to Black Market Growth. NEXT.io, November 2025. 6% GGR growth in high-tax markets vs 17% in lower-tax markets.
[16] bet365 Group Limited — Annual accounts, Companies House (company 05110007). FY2024 revenue £4.3bn, pre-tax profit ~£1bn.
[17] Super Group Q1 2026 Results — Africa segment revenue $267m, EBITDA $98m (37% margin). Africa 44% of total revenue. igamingfuture.com
[18] Super Group Q3 2025 — 37% growth in African iGaming revenue. igamingexpert.com
[19] Nigeria iGaming Market — largest four companies hold 70% of $3.63bn GGR. igamingtoday.com
[20] Africa total iGaming market $17.63bn in 2025 — igamingtoday.com (Liberia market report, Africa total estimate).
[21] Brazil CEB $2.95bn in H1 2025 — ainvest.com, LatAm iGaming Market report, December 2025.
[22] Brazil PIX — 90%+ of deposit traffic, banned credit cards and crypto for iGaming — SPA/MF regulation. kycaid.com, April 2026.
[23] PIX usage — 70%+ of Brazilian adults use PIX regularly — altenar.com, October 2025.
[24] LATAM iGaming market $6bn in 2025, projected $10-12bn by 2028 — SCCG Management, February 2026.
[25] EveryMatrix — LATAM margin compression quote: “markets become more rigid and structured, and then margins shrink.” everymatrix.com, April 2026.